Trace Monitoring (Tempo)
The MoAI Inference Framework bundles Grafana Tempo for distributed tracing. The Heimdall AI Gateway emits OpenTelemetry traces that show how it routes and schedules each request, and the moai-inference-framework chart provisions Tempo as a Grafana data source automatically. This guide shows how to view those traces in Grafana.
Enabling tracing
Tracing is off by default. To turn it on, point the Heimdall operator at the bundled Tempo OTLP endpoint by setting telemetry.trace.exporter.endpoint when you install or upgrade Heimdall.
telemetry:
  trace:
    exporter:
      # Bundled Tempo distributor (OTLP gRPC). Adjust the release name and
      # namespace if they differ from this guide (release "mif", namespace "mif").
      endpoint: http://mif-tempo-distributor.mif.svc.cluster.local:4317
Pass this file to the Heimdall install command in Prerequisites by adding -f heimdall-values.yaml.
To keep overhead low, the gateway records only about 5% of requests by default, so an individual request usually will not show up in Tempo. You can change this ratio in two places:
- All gateways: set the Heimdall chart value
telemetry.trace.sampler.argument(for example1.0to record every request). - A single gateway: override
OTEL_TRACES_SAMPLER_ARGon thatAIGatewaythrough itsspec.extraEnvVars.
To force one specific request to be recorded regardless of the ratio, see Capturing a specific request.
Accessing Grafana
See Accessing Grafana in the metrics guide for the admin credentials and port-forward steps.
Viewing traces
- Open Explore in Grafana (the compass icon in the left sidebar).
- Select the Tempo data source from the dropdown at the top.
- Find a trace using one of the Search query types:
- Search: filter by service name (
heimdall-aigateway), span name, duration, and so on. - TraceQL: write a query such as
{ resource.service.name = "heimdall-aigateway" }. - Trace ID: paste a known trace ID to open that trace directly.
- Search: filter by service name (
- Click a result to open the trace's waterfall view.
Capturing a specific request
Because only a fraction of requests are sampled, a one-off request may not be recorded. To guarantee a request is traced — and to give it a trace ID you can look up directly — send it with a traceparent header whose trailing flag is 01 (sampled). Add the header to the inference request from the Quickstart:
curl http://localhost:8000/v1/chat/completions \
  -H "Content-Type: application/json" \
  -H "traceparent: 00-aaaaaaaaaaaaaaaaaaaaaaaaaaaaaaaa-1111111111111111-01" \
  -d '{
    "model": "meta-llama/Llama-3.2-1B-Instruct",
    "messages": [{"role": "user", "content": "Hello!"}]
  }'
The header format is 00-<32-hex trace id>-<16-hex parent span id>-01. The gateway honors the sampled flag, so this request is always recorded under the trace ID you chose (here aaaa...aaaa). Paste that trace ID into the Trace ID search in Grafana to open it.
Reading an AI Gateway trace
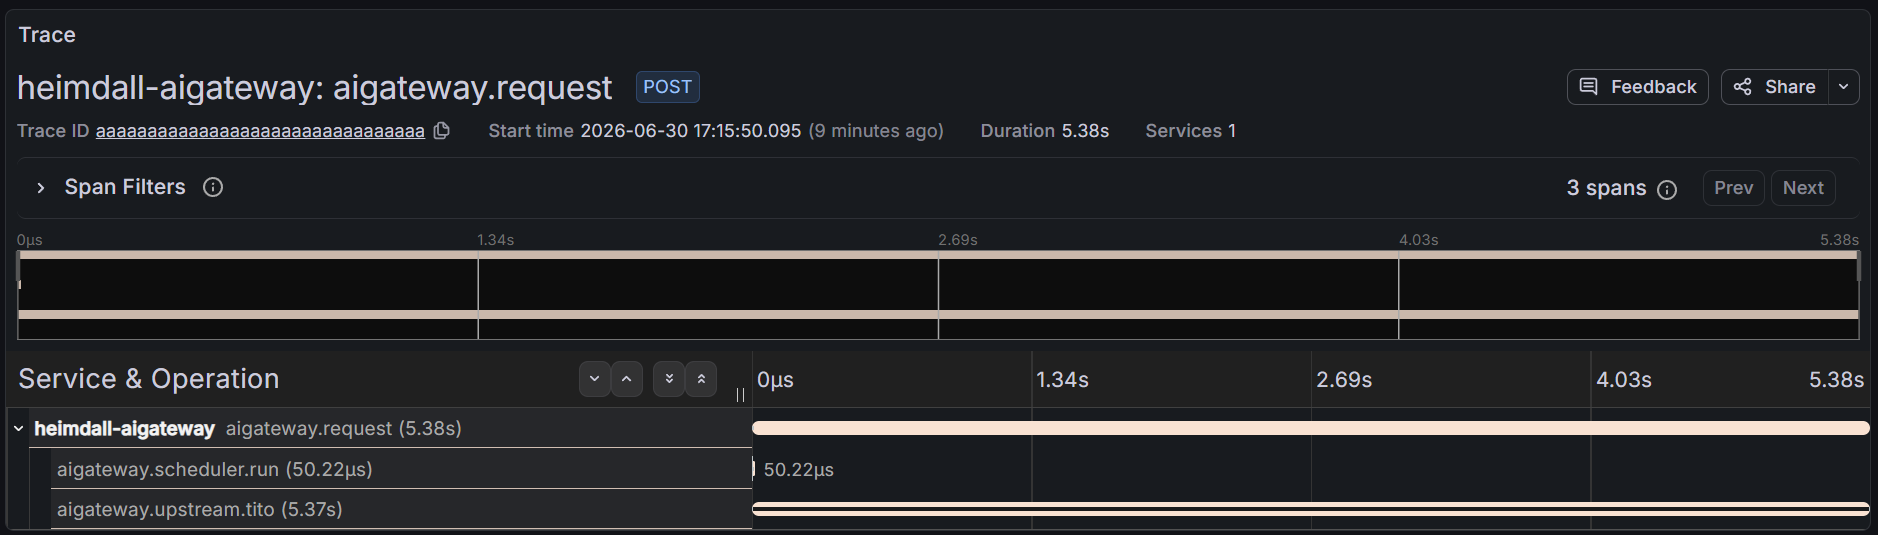
A gateway trace shows the routing and scheduling path of one request. An end-to-end request — like the one from the Quickstart — produces a small span tree:
aigateway.request            ← request received (root span)
├─ aigateway.scheduler.run   ← scheduling decision (scores candidate pods, picks one)
└─ aigateway.upstream.tito   ← call to the selected vLLM worker
In the waterfall, each span's bar shows where time is spent. Scheduling (aigateway.scheduler.run) takes microseconds, while almost all of the latency is the upstream worker call (aigateway.upstream.tito):
The exact spans depend on the scheduling profile:
- A profile that uses prefix-cache scoring adds
aigateway.kv_cache.*spans underaigateway.scheduler.run. - A prefill-decode (PD) profile adds
aigateway.pd.prefillandaigateway.pd.decodestages, each with its own scheduling run andaigateway.upstream.titocall.